What it is
MyGarden (Bahçem in Turkish) started with a simple worry: are my seedlings warm enough tonight? I wanted to know without walking to the shelf, and I wanted the answer to come from a real measurement instead of a guess.
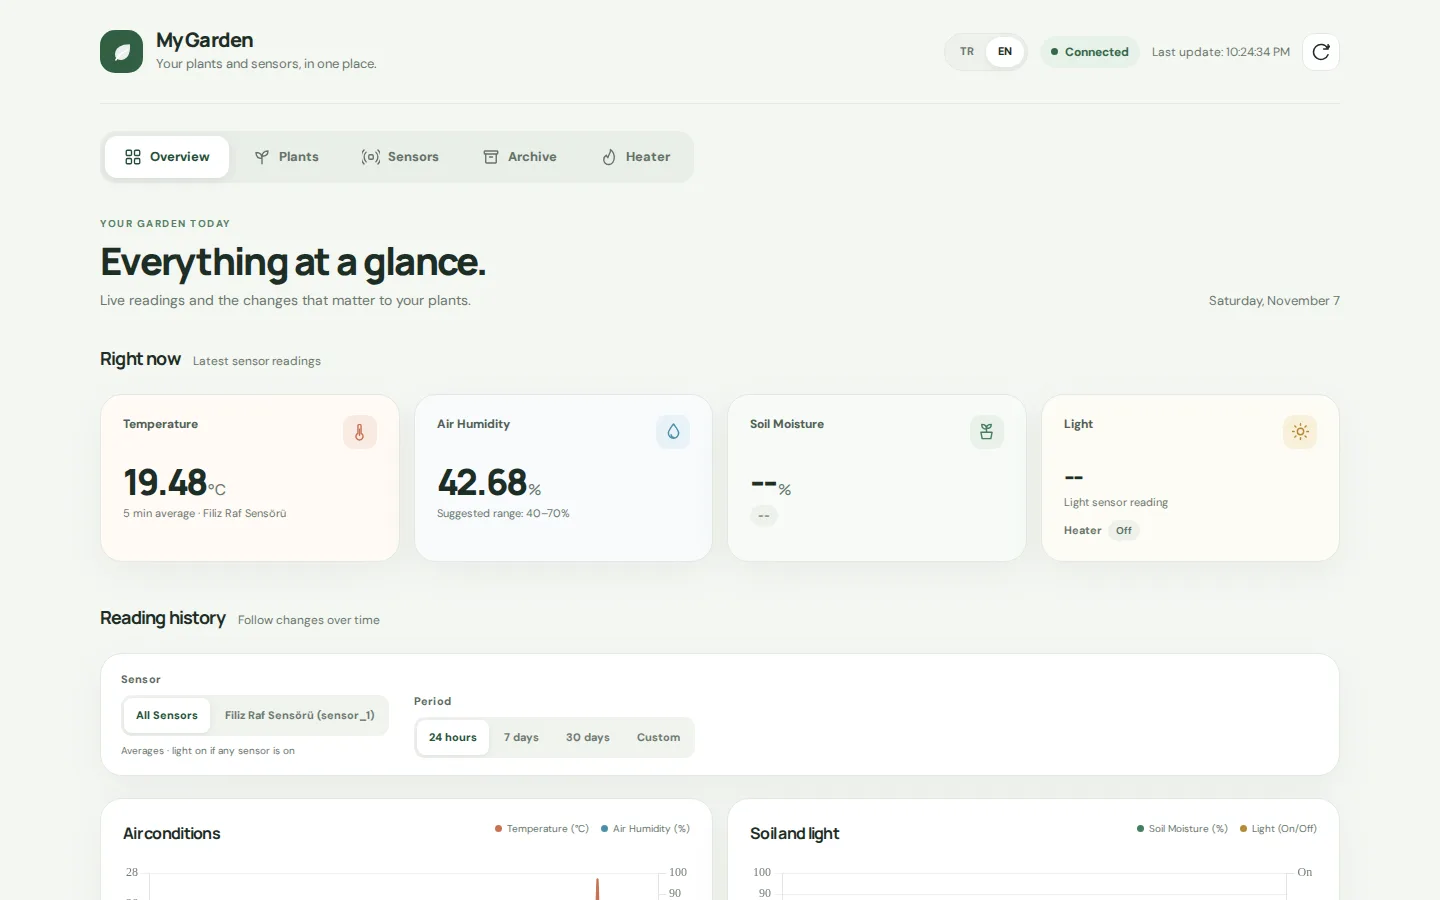
So I put an ESP32 with a DHT22 sensor and a small OLED screen next to the plants. It samples every 30 seconds, shows the values on the display and sends a five-minute average to a FastAPI backend I wrote. The web dashboard at alicanzade.com/mygarden shows the current temperature and humidity, charts for the last day, week or month, the plants on each shelf (one for sprouting, one for flowering and fruit) and a log for each plant.
The heater, carefully
The second part is warmth. A Tuya smart plug drives a small heater, and a separate service decides when it may run. During the day (06:00–19:00) it asks for heat below 23 °C and stops at 25 °C. At night the band is 19–22 °C.
Switching a heater from software is something I did not want to take lightly, so most of the code is about saying no:
- Only readings signed with the sensor’s own key count, and the key is checked with a constant-time comparison.
- A reading older than eight minutes is treated as invalid.
- Each new reading can start at most one 35-second pulse. Crossing the upper limit or getting a bad reading ends it early.
- Before live mode is allowed, the service confirms through the Tuya API that the plug has its own 35-second auto-off and stays off after a power cut, so the plug turns itself off even if my server goes quiet.
The heater logic is covered by unit tests, and every relay change goes to a heater log you can page through in the dashboard.
What I learned
The honest lesson is in my own notes: a smart plug and a script are not a thermostat. If the internet or the cloud drops, an “off” command may never arrive. That is why the system has an observation mode, why the plug carries its own timer, and why I treat unattended heating as something that needs a proper heater with its own thermal cut-off.
Where it stands
It runs every day on my shelves. The live ESP32 temperature is shown separately from the averages, the relay state refreshes every five seconds, and deployment goes through a GitHub Actions workflow to nginx and systemd services.